

Making Air Quality Data Work for Communities
The launch of a new air quality dashboard created in partnership with Air Alliance Houston

In Houston's industrial adjacent communities, real-time air quality data is essential for public health. I'm very proud to launch a new air quality dashboard I developed and designed in partnership with Air Alliance Houston for their Community Air Monitoring Program (CAMP).
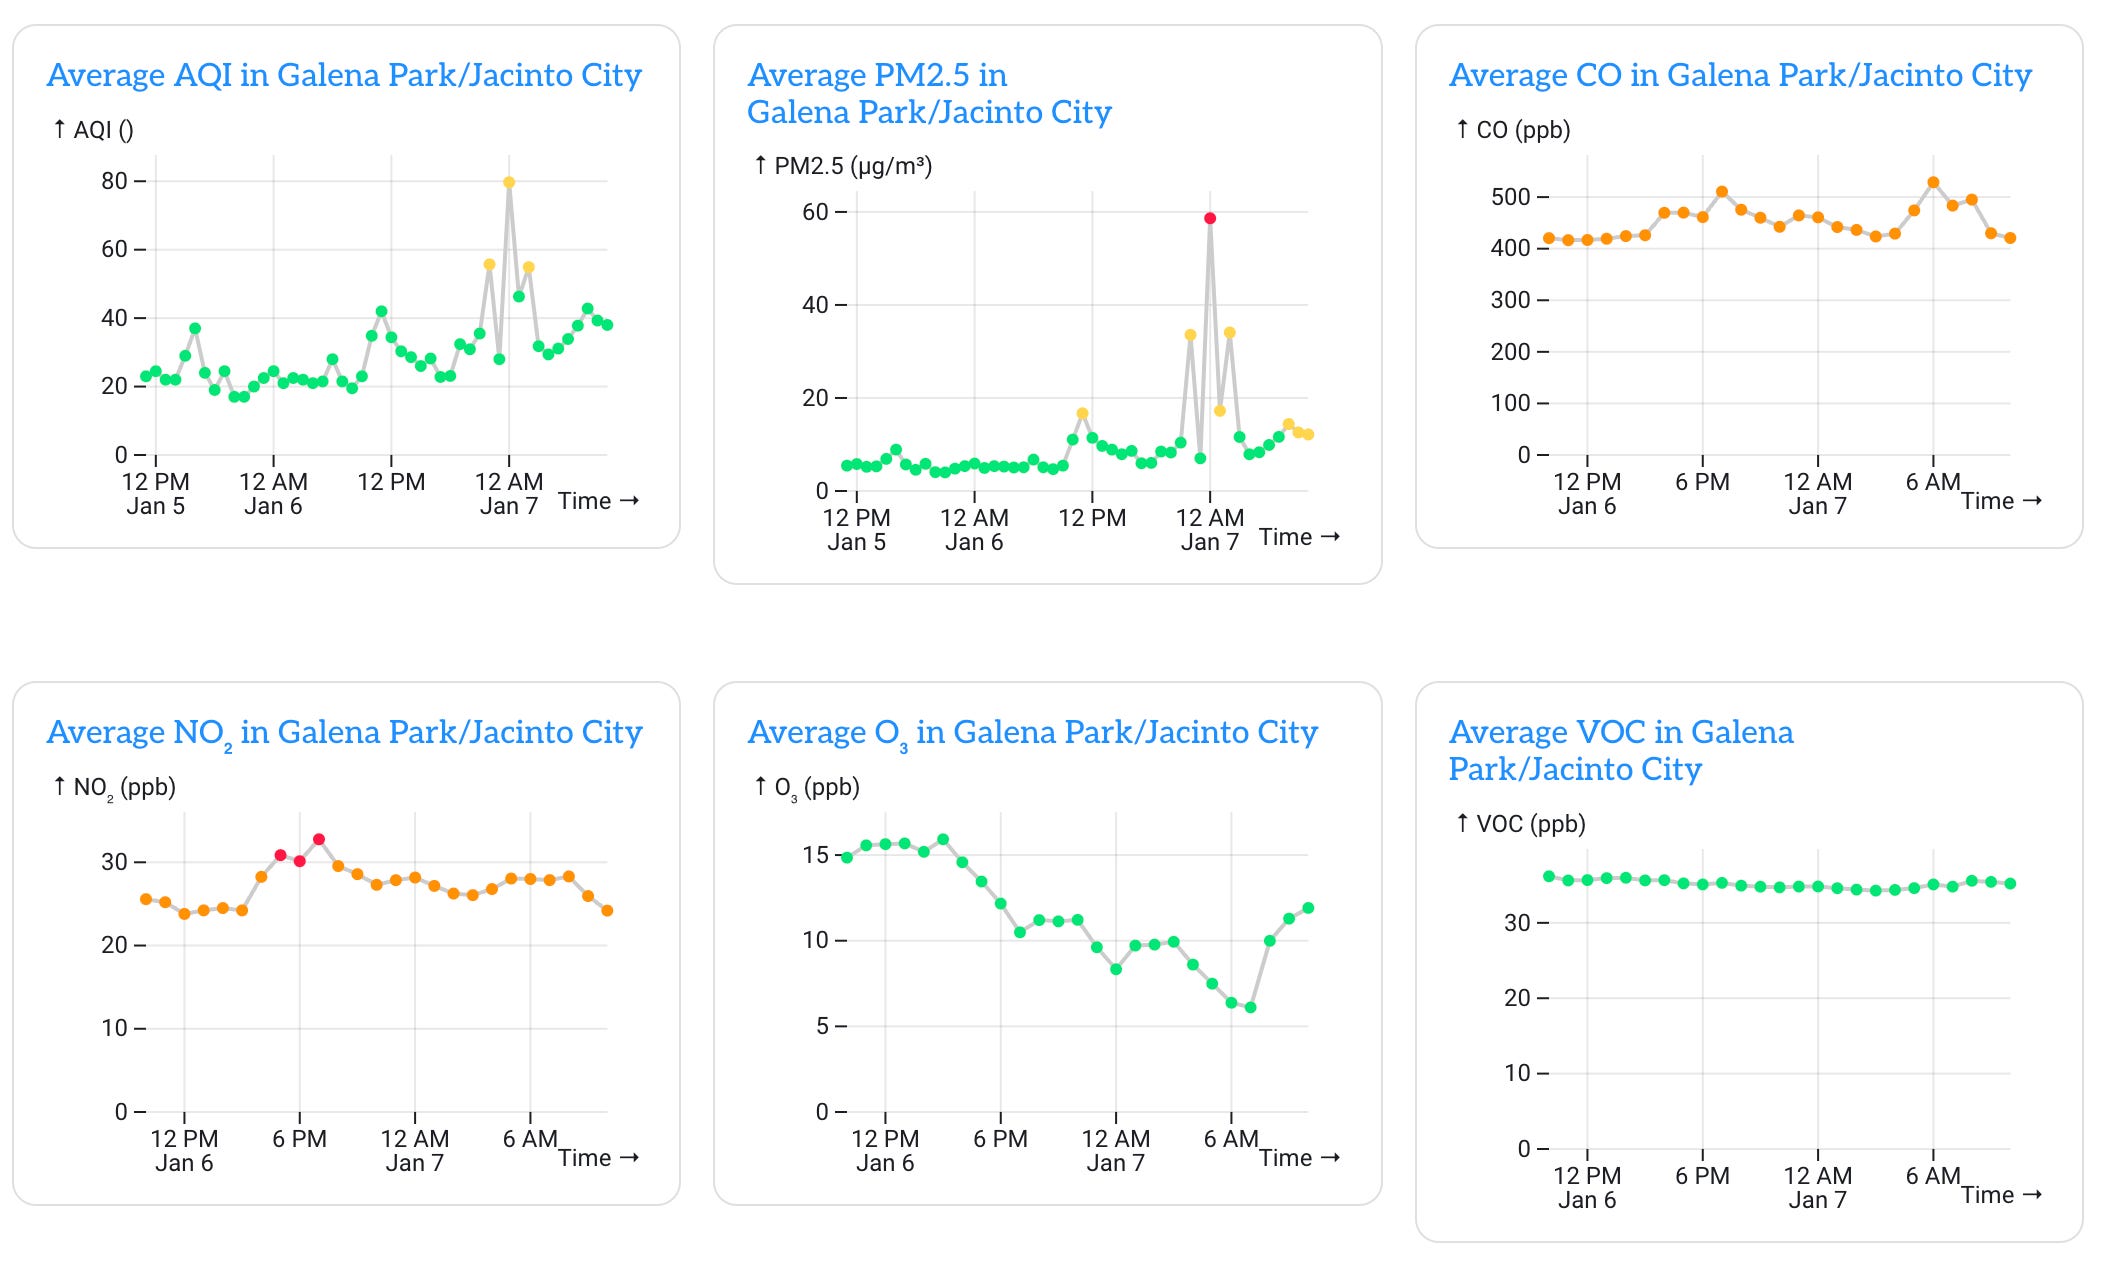
The dashboard provides immediate access to air quality readings with a focus on eight neighborhoods: Galena Park/Jacinto City, Pasadena, Near Northside/Northline, Kashmere Gardens, Baytown, Channelview, Deer Park, and East Houston/Settegast, making this complex data accessible to everyone.
How It Works
The dashboard combines data from two different sensor networks (PurpleAir and Sensit) into one intuitive and accessible interface.
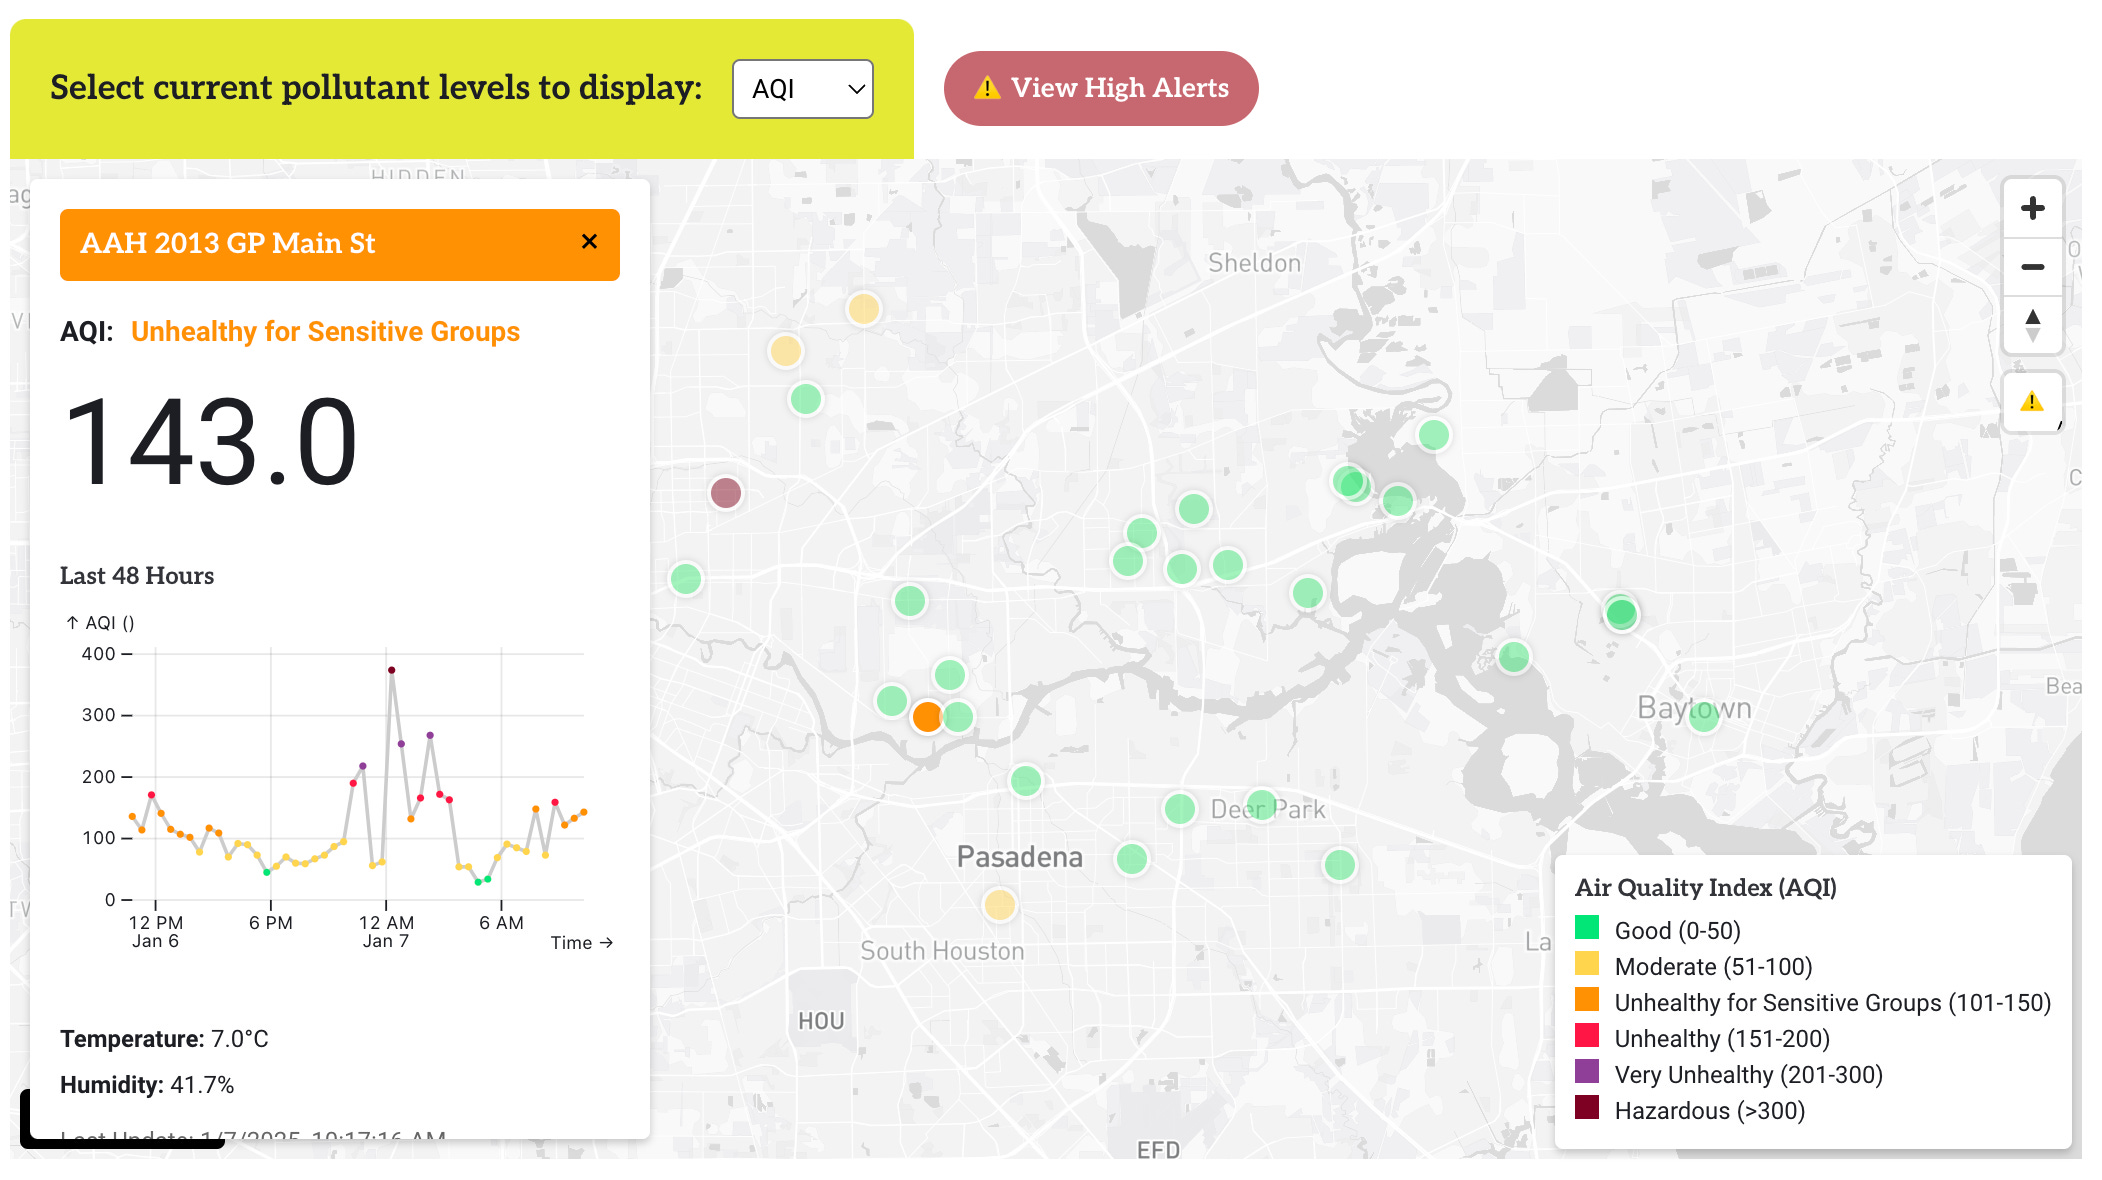
The interactive map lets you explore real-time readings of AQI, PM2.5, ozone, carbon monoxide, nitrogen dioxide, and volatile organic compounds (VOCs). Each sensor location is color-coded to show current conditions, with detailed information across the past 48 hours available in pop-up windows.
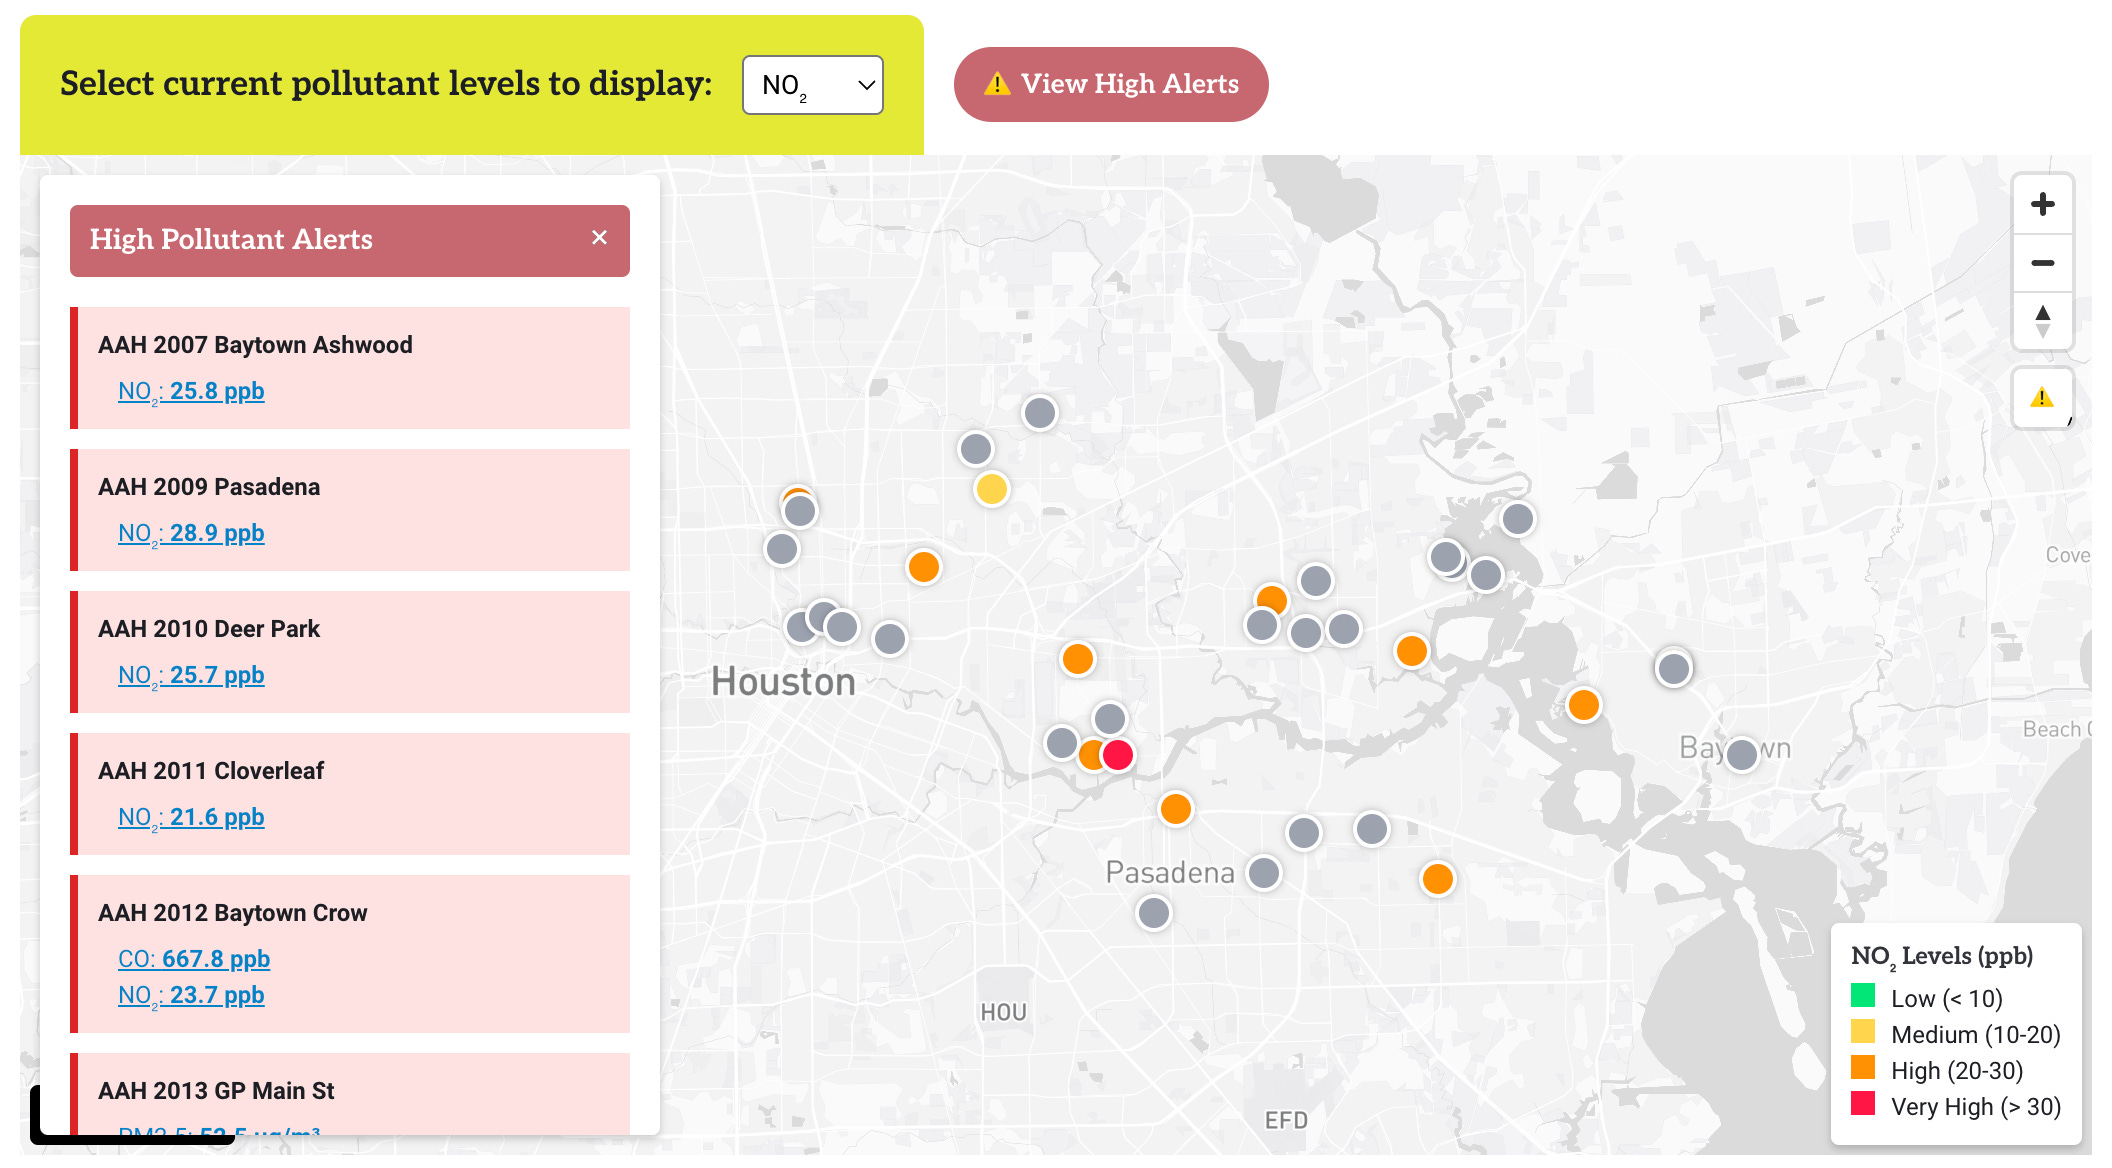
One key feature we developed is the "View High Alerts" panel, which automatically surfaces any concerning pollutant levels across the network. No need to check individual sensors – if there's a potential issue, you'll know right away.
What’s next
This project demonstrates how we can make environmental data both sophisticated and accessible. By combining open-source tools with powerful mapping technology, we've created a system that serves everyone from concerned residents to environmental researchers. AAH's Air Quality Ambassadors will be using this dashboard for community engagement and education, helping residents better understand and advocate for their environmental health.
I'm excited to see how communities will use this tool to better understand and advocate for their environmental health. You can view this dashboard and learn more about the Community Air Monitoring Program here: airalliancehouston.org/air-monitoring
Does your organization need to convey complex information through data visualization? Let’s talk.